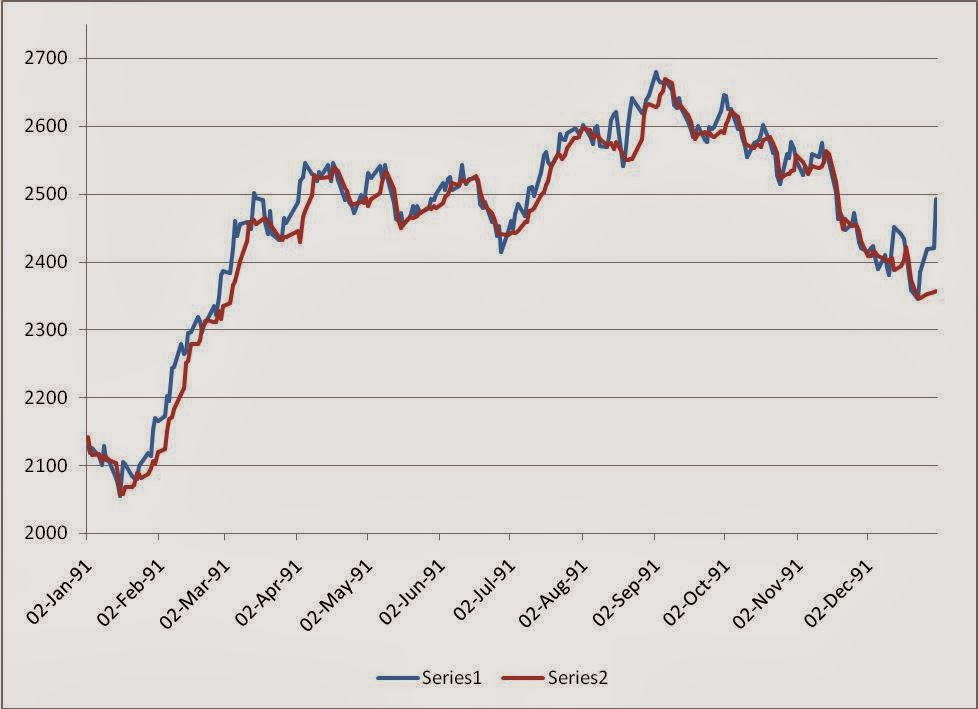
Now I am going to present you the sample charts for my own methods. These are the charts, in which, there are two lines. A blue line for close values and a red line for my own average instead of DMA. I have several methods of calculating averages. It can be any one of them.
The basics remain the same. If the close line (blue) intersects the average line (red line) from below, you get a buy signal. On the contrary, if the close line (blue) intersects the average line (red line) from above, you get a sell signal
Study these charts to find out how powerful these signals are.


I want you to study these charts in detail and to find out where the buy/sell signals ar generated. I also want you to find out what happens thereafter. If you take a long position on the basis of a buy signal, whether the close value really goes up or not, if yes, to what extent and within hou much period of time.
In short, I want you to find out what are your chances of successful trading if you use my averages.
By the way, I will be presenting the answers to these questions in my next post.
Please share your views and comments on my blog.
Till then, I wish you all successful trading in stock markets.
Thanks and regards,
Hemant Kanade
No comments:
Post a Comment